
Cover illustration; not an identified property or verified street photograph.
Updated September 29, 2026. By Vikas Shah, CA DRE #02235333 | 408-650-3463
Palo Alto can be a demanding cash-flow investment because acquisition prices are high. Decide using the property’s actual rent, operating costs and financing; a desirable city or a rising monthly median does not by itself produce a positive return.
Palo Alto prices: August 2026 closed sales
| Property category | Median sale price | Closed sales | Median days on market |
|---|---|---|---|
| Single-family homes | $4,005,000 | 32 | 11 |
| Condos + townhomes combined | $1,685,000 | 9 | 31 |
Source: Aculist / MLSListings city report, August 2026, retrieved September 29, 2026. These are closed-sale medians, not asking prices or a value estimate for a particular home. Attached housing is one combined category; the report does not supply separate condo and townhome medians here. Changes in the mix of homes sold can move the median.
An illustrative rental model with every assumption visible
This is a hypothetical $2 million property, not an available listing or a market-rent estimate. Assume 25% down, a $1.5 million loan at 6.5% for 30 years, $7,000 monthly rent, 5% vacancy, management at 8% of collected rent, $24,000 annual tax, $3,600 insurance and $10,000 maintenance/capital reserve.
| Annual item | Calculation / amount |
|---|---|
| Scheduled rent | $84,000 |
| Rent after 5% vacancy | $79,800 |
| Management, 8% of collected rent | $6,384 |
| Tax + insurance + maintenance reserve | $37,600 |
| Net operating income before financing | $35,816 |
| Annual loan principal and interest | $113,772 |
| Cash flow before tax and other costs | $-77,956 |
The modeled cap rate is about 1.79% ($35,816 ÷ $2 million). Cash flow is approximately negative $78,000 per year before HOA dues, utilities, leasing costs and other omitted items. The rent assumption is deliberately transparent; replace it with documented comparable leases before evaluating a real property.
What rent would this model need to break even?
With the same vacancy and management percentages, about 87.4% of scheduled rent remains before the fixed expenses. The annual fixed operating allowance plus debt service totals about $151,373. Dividing by 0.874 and then 12 yields roughly $14,433 monthly break-even scheduled rent. That is a model result—not evidence that the property can command that rent.
Separate three sources of return
- Operating cash flow: collected rent less all expenses and debt service.
- Loan principal reduction: equity accumulation that is not spendable monthly income.
- Resale change: uncertain future value less transaction and improvement costs.
Do not add assumed appreciation to cash flow and describe the result as guaranteed yield. A 10% price decline on this $2 million purchase is $200,000, equal to 40% of the original $500,000 down payment before loan amortization and sale costs. Leverage magnifies downside as well as upside.
Due diligence that can change the decision
| Question | Evidence needed |
|---|---|
| What rent is achievable? | Comparable executed leases with size, condition, parking and date |
| Can the intended use legally operate? | Current city rules, permit history and any HOA rental restrictions |
| What is deferred? | Inspection findings and written capital-repair bids |
| What survives a vacancy? | Cash reserves after closing and a stress test for several empty months |
When to keep looking
If the investment only works with an undocumented rent increase, an unapproved accessory unit or appreciation high enough to cover persistent losses, the model has not established a sound purchase. Compare another property, a different down payment or a different investment rather than forcing the numbers. Consult appropriate tax and legal professionals for your circumstances.
Related guides and next steps
- https://findbayhomes.com/listing
- https://findbayhomes.com/contact
- Find Bay Homes mortgage calculator
- Find Bay Homes property valuation tool
- Palo Alto Luxury Real Estate Guide 2026 | High-End Homes & Exclusive Neighborhoods
- Best Neighborhoods in Palo Alto for Families in 2026
Discuss your property, budget and timing with Vikas Shah, CA DRE #02235333, FindBayHomes | Doorlight Inc., CA DRE #02219383. Call 408-650-3463 or email vikas@findbayhomes.com. Calculations and online valuation tools are estimates, not loan approvals or guaranteed sale prices.
FROM OUR BLOG


Selling a Santa Clara Home: Pricing Evidence, Documents & Offer Net
To sell a Santa Clara home, build the price from comparable closed sales, resolve document questions before launch, and compare offers on estimated net proceeds and execution. A citywide median is context, not a price for your house. A higher offer can leave less cash after credits and extra carryin

How Mortgage Rates Change Bay Area Buying Power
A higher mortgage rate reduces the home price supported by the same monthly budget. But the useful buying-power number includes taxes, HOA dues, insurance and cash left after closing—not just principal and interest. In the original example below, a rise from 6.50% to 7.00% lowers the monthly-budget
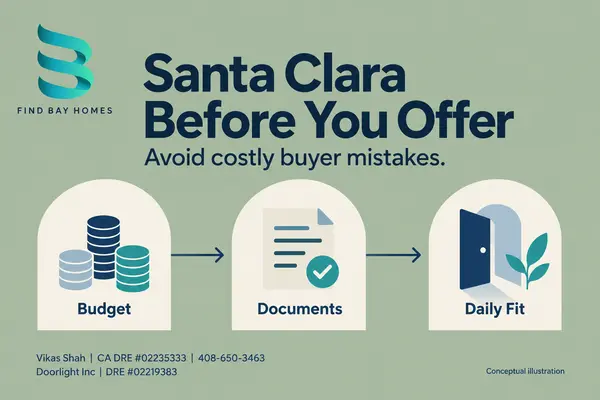
Santa Clara Home-Buying Mistakes: 8 Checks Before You Offer
Conceptual illustration, not a photograph of a property or local landmark. By Vikas Shah | CA DRE #02235333 | 408-650-3463Reviewed October 9, 2026 Before offering on a Santa Clara home, confirm three things: the purchase leaves enough cash after closing, the documents support how you intend to use t